Core Web Vitals: What They Are and How to Actually Fix Them
The three metrics, the thresholds, what Google really says about ranking, and why your Lighthouse score is not the number Google is looking at.
Caliency
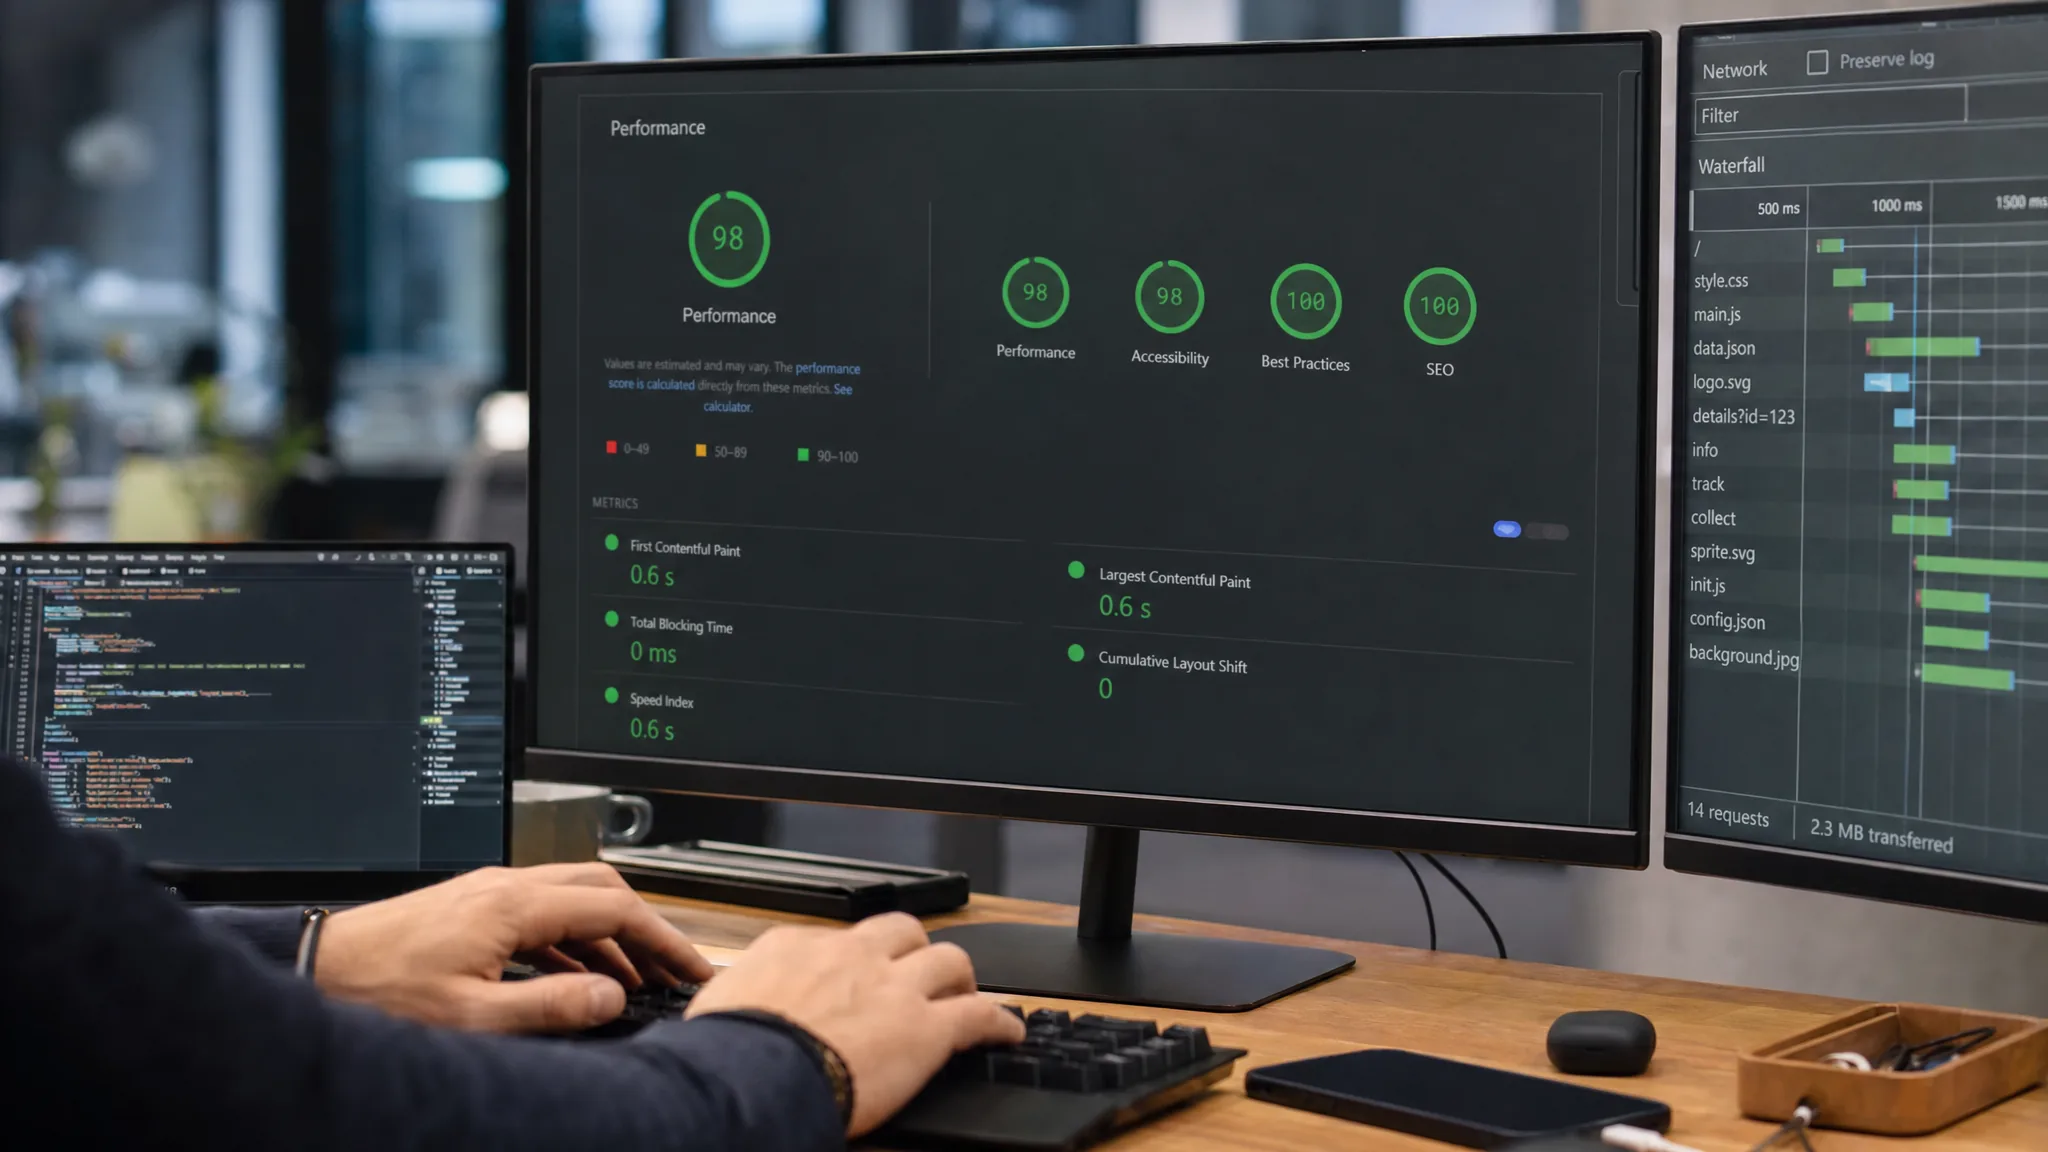
Core Web Vitals are three measurements of how a page behaves for the person using it: Largest Contentful Paint should occur within 2.5 seconds, Interaction to Next Paint should be 200 milliseconds or less, and Cumulative Layout Shift should be 0.1 or less. Each is judged at the 75th percentile of page loads, assessed separately for mobile and desktop (web.dev).
That is the easy part, and every guide gets it right. What most of them get wrong is the next question — what fixing them is actually worth, and which number you should be reading.
Key Takeaways
- The thresholds: LCP 2.5s, INP 200ms, CLS 0.1, at the 75th percentile (web.dev).
- Google says Core Web Vitals are used by its ranking systems, and in the same breath that "there is no single signal" and good scores don't guarantee rankings (Google Search Central).
- Your Lighthouse score is lab data. Google reads field data from real Chrome users (Chrome UX Report). The two disagree routinely.
- On our own site, the two biggest wins were an image weight problem and a caching header — neither was a code optimisation.
- INP replaced FID as a stable Core Web Vital in 2024 and is materially harder to pass.
What the three metrics actually measure
Largest Contentful Paint (LCP) — when the largest piece of content in the viewport finishes rendering. In practice: how long the visitor stares at something that is not yet the page.
Interaction to Next Paint (INP) — the delay between a user interacting and the screen visibly responding, across all interactions on the page rather than just the first. It replaced First Input Delay and became a stable Core Web Vital in 2024 (web.dev). It is harder to pass, because a page can be quick to accept the first tap and sluggish for every one after.
Cumulative Layout Shift (CLS) — how much the page moves under the reader after it has started rendering. This is the one users describe without naming: tapping the wrong button because an advert loaded above it.
The 75th percentile matters more than people expect. You are not being judged on your average visitor; you are being judged near the slow end of your traffic. A site that is fast on office wifi and unusable on a train platform fails, correctly.
What Google actually says about ranking
Google's page experience documentation says two things that most guides quote only half of:
"Core Web Vitals are used by our ranking systems. We recommend site owners achieve good Core Web Vitals for success with Search."
"There is no single signal. Our core ranking systems look at a variety of signals that align with overall page experience."
And then, plainly:
"getting good results in reports like Search Console's Core Web Vitals report or third-party tools doesn't guarantee that your pages will rank at the top of Google Search results; there's more to great page experience than Core Web Vitals scores alone."
(Google Search Central, page experience, last updated 10 December 2025.)
Read together: the metrics are used, and they are not a lever. If somebody quotes you a ranking gain for a Core Web Vitals project, they are quoting something Google's own documentation declines to promise.
The defensible reason to do the work is different and better: these metrics measure whether a person can use your page. That affects whether they buy, whether or not it affects where you rank. Our SEO service treats speed as part of the technical foundation rather than as a ranking tactic, for exactly this reason.
What this signal looks like in practice, measured with Google's real-user data across 200 popular Turkish sites, is in does site speed affect SEO.
Your Lighthouse score is not the number Google reads
This single misunderstanding wastes more engineering hours than any other in this area.
Lighthouse is lab data. One machine, one simulated network, one run. It is a diagnostic — excellent for finding causes, poor for describing reality.
Search Console reports field data, drawn from the Chrome User Experience Report: "a dataset that reflects how real-world Chrome users experience popular destinations on the web", collected from "real browsers around the world, based on certain browser options which determine user eligibility" (Chrome UX Report).
Two consequences follow, and both are common:
- A perfect lab score with failing field data. Your test machine is not your audience's phone on a bad connection.
- No field data at all. CrUX notes that "not all origins or pages are represented in the dataset" — pages need enough traffic to be statistically significant. A new or low-traffic site can have nothing to read, which is not the same as passing.
So: use Lighthouse to find the cause, and field data to decide whether there is a problem worth chasing. Doing it the other way round produces months of work aimed at a number nobody outside your team ever sees.
What actually moved ours
We rebuilt this site's performance recently, and the honest account is more useful than a checklist — because the two things that mattered most were not the things we expected.
Where it started and ended, on the homepage:
- Desktop: 78 → 97.
- Mobile: 66 → 82.
The two largest single wins:
A caching header that was quietly wrong. Media files were served with immutable, which tells a browser it never needs to re-check the file. That is correct only when filenames carry a content hash. Ours did not. Every visitor would have held stale images for a year, and we found it only because updated images were not appearing. It cost nothing to fix and no performance tool flags it as a performance problem.
Images nobody had weighed. Eleven avatar photographs, shipping as JPEGs at full resolution, came to 1,788 KB. As correctly sized WebP they came to 44 KB. That is a 97% reduction on one row of small round portraits — and it took longer to notice than to fix.
And the one that taught us the most about LCP: an opening animation drew a full-bleed opaque overlay across the hero, and it stayed opaque until the JavaScript had loaded and hydrated. Nothing behind it could count as painted. LCP was therefore pinned to hydration time rather than to anything about the content. Moving the animation to CSS — the same animation, driven by the stylesheet instead of a bundle — decoupled the two.
None of those three is a clever optimisation. They are, in order: a header, a file size, and an animation that waited for JavaScript it did not need.
The order we work in
Not a checklist — a sequence, because the order is what saves the time.
- Read field data first. Search Console, or CrUX directly. If the field data passes, you do not have a Core Web Vitals problem, whatever Lighthouse says.
- Identify the LCP element. Lighthouse names it. Nine times in ten the fix follows immediately from knowing what it is: an oversized hero image, a webfont, or something hidden behind JavaScript.
- Weigh what you ship. Convert images to WebP or AVIF at the size they are displayed. This is unglamorous and it is usually the largest available win.
- Check that nothing above the fold waits on JavaScript. Content that is invisible until hydration cannot count as painted.
- Reserve space for anything that loads late. Images with intrinsic dimensions, ad slots with fixed heights. Nearly all CLS is space that was not reserved.
- Only then chase INP. It is usually a symptom of too much JavaScript executing on the main thread, and it is the hardest of the three to fix cheaply.
If you are rebuilding rather than repairing, what a website actually involves covers where speed decisions get made — which is earlier than most teams think.
In short
Fix Core Web Vitals because they measure whether people can use your site, not because someone promised you rankings for it — Google's own wording will not support that promise. Read field data to decide whether you have a problem, and lab data to find its cause. And weigh what you are shipping before you optimise how it executes; the largest wins are usually embarrassingly boring.
If your site is slow and you would rather have someone diagnose it than guess, tell us what you are working with.
If you want to see where large corporate sites actually stand on technical foundations, our BIST 100 website study reports the measurement of 85 home pages.
Got a project in mind?
We'll scope it and give you a fixed price on one call.
Keep reading
Website Development in 2026: The Complete Guide
Which kind of website you actually need, custom code versus WordPress, realistic budget and timeline. Written to help you decide, not to sell.
→Web DevelopmentNext.js vs WordPress: What Popular Sites Actually Use
WordPress is a CMS, Next.js a React framework. We scanned 162 popular Turkish sites: Next.js runs 12.3 percent, WordPress 5.6. Who should pick which?
→